code, Scraping

Automated Amazon Purchasing

Earlier today there was a issue with Amazon’s promo code system that caused Amazon Echo’s to be free for Prime customers. Amazon Echo Dot for FREE!!!!! Go all the way to checkout to see a $50 Audible credit applied – obviously price errorhttps://t.co/ap18baZWJy pic.twitter.com/qKBM3lpX43 — IGN Deals (@IGNDeals) August 18, 2017 Like we did with… Read More Automated Amazon Purchasing

code, data, Home Page, MLB, Parallel Coordinates, sports, Time Series, Visualization, Visualization Vednesday

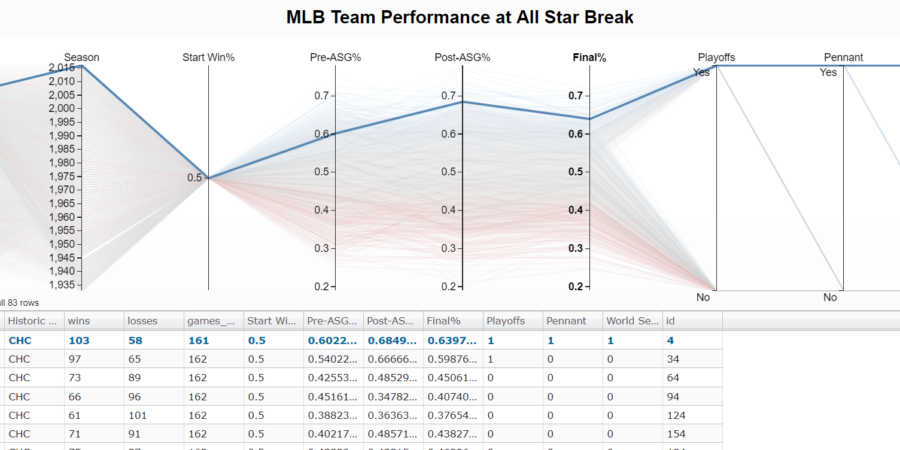
Are the Cubs Bad Again? Visualizing MLB Team Records at the All Star Break

With the all star break upon us, I wanted to see how team records at the all star break compare to full season performance. The Chicago Cubs sit below .500 with a 43-45 record (.489) and as a White Sox Fan I get giddy at the prospect of them not doing well again. Last season… Read More Are the Cubs Bad Again? Visualizing MLB Team Records at the All Star Break

code, data, Home Page, python, Time Series, Time Series, Visualization, Visualization Vednesday

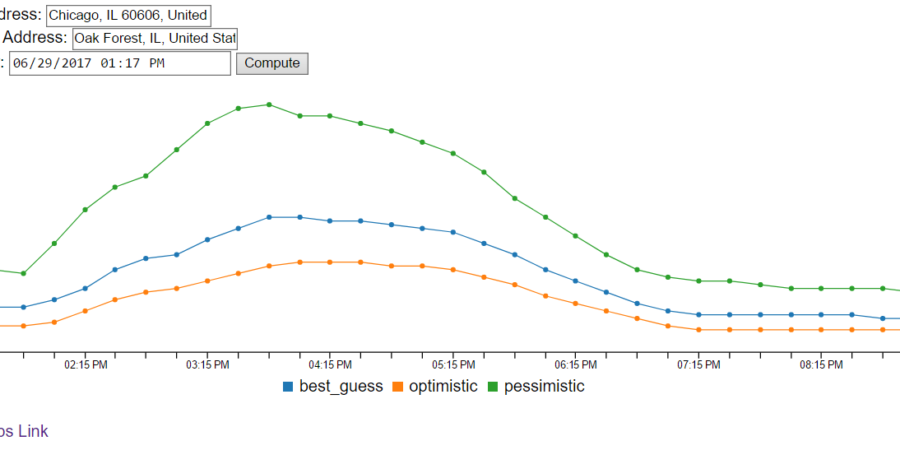
Visualization Vednesday: Travel Times Interactive Version

Last week, I wrote about using the Google Maps API to visualize travel times according to when you want to leave by using their “Depart at” feature to simulate traffic. This week I took it a step further and made an interactive version. Go give it a try next time you have to drive somewhere, especially… Read More Visualization Vednesday: Travel Times Interactive Version

code, python, Time Series, Visualization, Visualization Vednesday

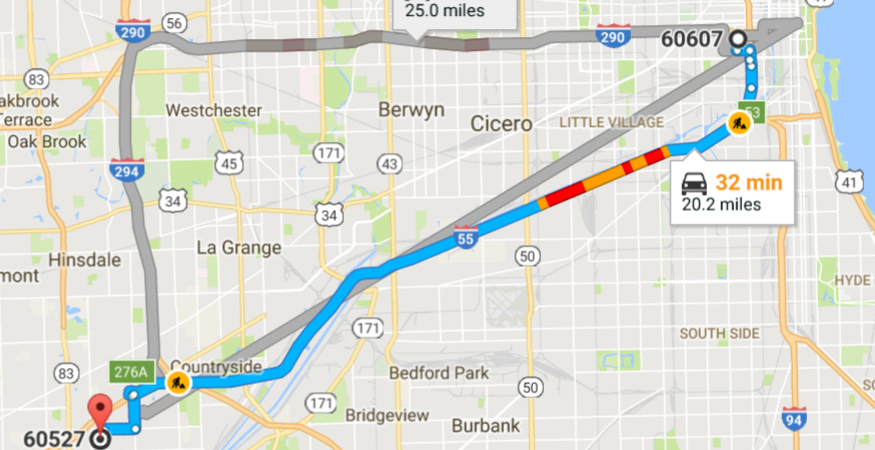
Visualization Vednesday: Travel Times

I’m starting a new posting series called “Visualization Vednesday” where I’ll talk about or create a visualization and critique it. For this first post, let’s talk about Google Maps and travel times. Travel Times Problem Yesterday I had to drive home from my parents house to go to dinner with my grandma who had just… Read More Visualization Vednesday: Travel Times